Instrumental Variable Design
Goal of today
We replicate Liu et al (2021) that surveillance infrastructure and repression. The full replication materials can be found here.
Load necessary packages
rm(list=ls(all=TRUE))
cat("\014")
# Load packages -------------------
source('loadPkg.R')
packs = c('tidyverse', 'xtable', 'estimatr', 'texreg','ggplot2', 'RColorBrewer', 'extrafont', 'ggplot2')
loadPkg(packs)Show all package versions
utils:::print.sessionInfo(sessionInfo()[-8],locale = FALSE)## R version 4.4.1 (2024-06-14)
## Platform: aarch64-apple-darwin20
## Running under: macOS 15.6.1
##
## Matrix products: default
## BLAS: /Library/Frameworks/R.framework/Versions/4.4-arm64/Resources/lib/libRblas.0.dylib
## LAPACK: /Library/Frameworks/R.framework/Versions/4.4-arm64/Resources/lib/libRlapack.dylib; LAPACK version 3.12.0
##
## attached base packages:
## NULL
##
## other attached packages:
## [1] extrafont_0.19 RColorBrewer_1.1-3 texreg_1.39.4 estimatr_1.0.4
## [5] xtable_1.8-4 lubridate_1.9.3 forcats_1.0.0 stringr_1.5.2
## [9] dplyr_1.1.4 purrr_1.1.0 readr_2.1.5 tidyr_1.3.1
## [13] tibble_3.3.0 ggplot2_4.0.0 tidyverse_2.0.0
##
## loaded via a namespace (and not attached):
## [1] gtable_0.3.6 xfun_0.49 bslib_0.8.0 lattice_0.22-6
## [5] tzdb_0.4.0 vctrs_0.6.5 tools_4.4.1 generics_0.1.4
## [9] sandwich_3.1-1 pkgconfig_2.0.3 Matrix_1.7-0 S7_0.2.0
## [13] lifecycle_1.0.4 compiler_4.4.1 farver_2.1.2 codetools_0.2-20
## [17] htmltools_0.5.8.1 sass_0.4.9 yaml_2.3.10 Rttf2pt1_1.3.12
## [21] Formula_1.2-5 pillar_1.11.1 jquerylib_0.1.4 extrafontdb_1.0
## [25] MASS_7.3-60.2 cachem_1.1.0 multcomp_1.4-26 tidyselect_1.2.1
## [29] digest_0.6.37 mvtnorm_1.3-3 stringi_1.8.7 bookdown_0.40
## [33] splines_4.4.1 fastmap_1.2.0 grid_4.4.1 cli_3.6.5
## [37] magrittr_2.0.4 survival_3.6-4 TH.data_1.1-2 withr_3.0.2
## [41] scales_1.4.0 estimability_1.5.1 timechange_0.3.0 rmarkdown_2.29
## [45] httr_1.4.7 emmeans_1.10.1 blogdown_1.19 zoo_1.8-14
## [49] hms_1.1.3 coda_0.19-4.1 evaluate_1.0.1 knitr_1.49
## [53] rlang_1.1.6 Rcpp_1.1.0 glue_1.8.0 rstudioapi_0.16.0
## [57] jsonlite_1.8.9 R6_2.6.1Visualization of the outcome on a map
# 2) Figure 1
# Load mapping data
load('mapData.rda')

pal3 <- colorRampPalette(c("white", "red")) # Create the color palette and breaks
breaks <- c(quantile(damage_data$damage))

q <- ggplot(data = polygon_data, aes(x = long, y = lat, group = group))
q <- q + geom_polygon(color = "lightgrey", aes(fill = factor(damage)))
q <- q + ggtitle("Blue Circles: Epicenters, Black Line: Motagua Fault")
q <- q + labs(fill="Damage")
q <- q + scale_fill_manual( values = pal3(19), breaks= breaks )

# add new layer (point data)
q <- q + geom_point(aes(x = longitude, y = latitude, group = NULL), data = point_data, color = alpha("blue", .35), size = point_data$mag)
q <- q + geom_point(aes(x = longitude, y = latitude, group = NULL), data = point_data, color = alpha("blue", .35), size = 0.2)

# add fault data
q <- q + geom_line(aes(x = long, y = lat, group=NULL), data = polyline_fault_data, color = alpha("black", .75), size =1.5)
q <- q + theme(text = element_text(size=10,  family="serif"))
q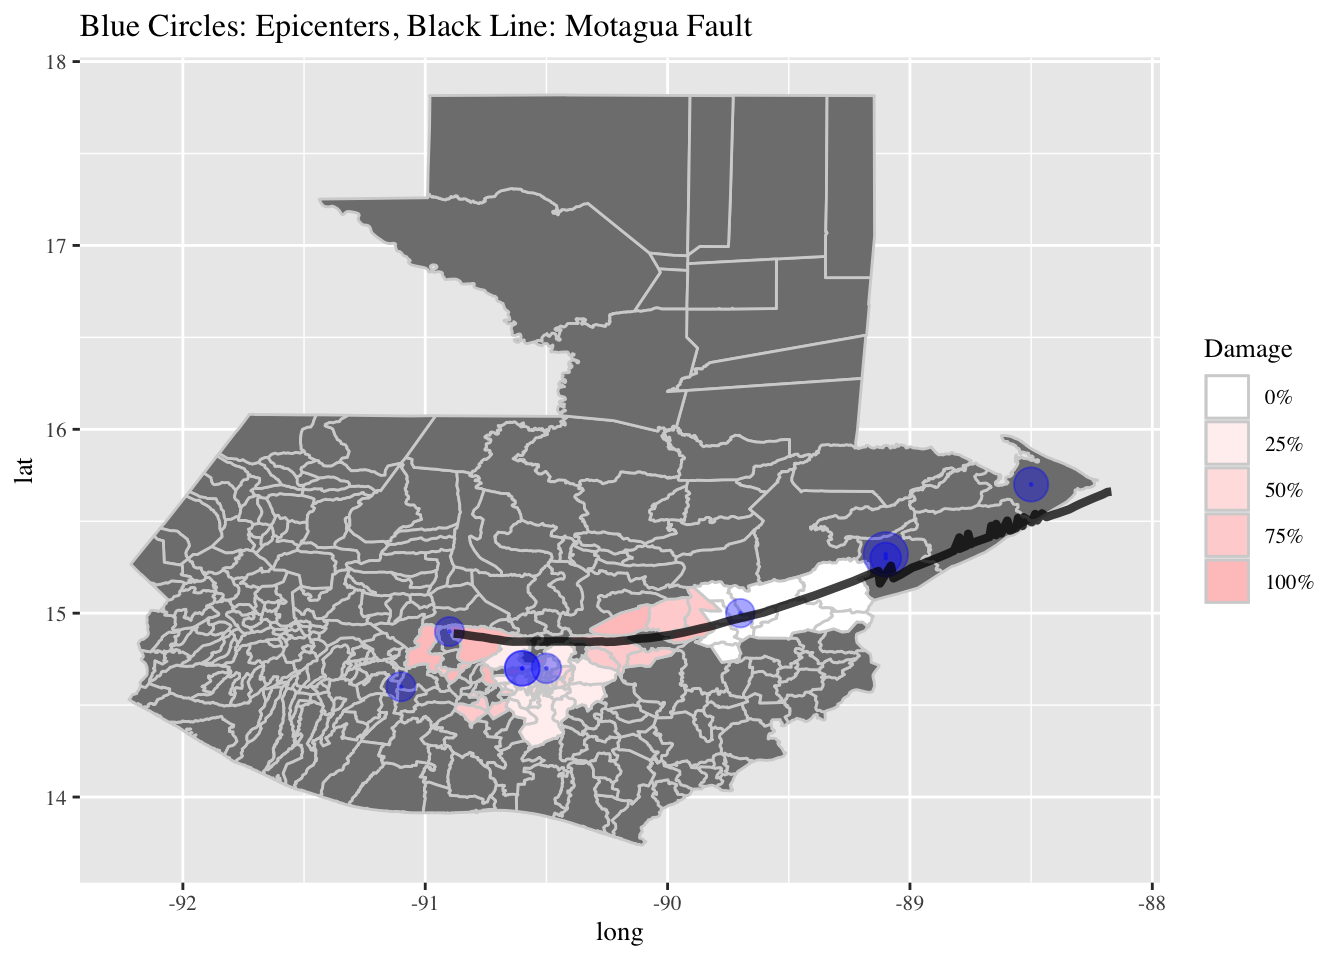
# png(filename='replication/paper/map_quake_muni2.png' ,width = 600, height = 500, res= 100)
# q
# dev.off()
Analysis
# Analysis (Manuscript) ----------------

modData[,4:ncol(modData)] = modData[,4:ncol(modData)] %>% scale() # standardize covariates

iv = iv_robust(PoliceRepression_bin ~ damage_decay +
                 CaAHPN + MobyAHPN + Campaign + ViolAHPN + lnpop | fault +
                 CaAHPN + MobyAHPN + Campaign + ViolAHPN + lnpop,
               alpha = 0.05,
               data = modData, se_type = "stata", clusters = munid)

iv1 = iv_robust(PoliceRepression_bin ~ damage_decay +
                  CaAHPN + MobyAHPN + Campaign + ViolAHPN + lnpop +
                  militarybase + militarybasespat + coppedge | fault +
                  CaAHPN + MobyAHPN + Campaign + ViolAHPN + lnpop +
                  militarybase + militarybasespat + coppedge ,
                alpha = 0.05,
                data = modData, se_type = "stata", clusters = munid)

iv2 = iv_robust(PoliceRepression_bin ~ damage_decay + PoliceRepression_sw +
                  CaAHPN + MobyAHPN + Campaign + ViolAHPN + lnpop +
                  militarybase + militarybasespat + coppedge | fault + PoliceRepression_sw +
                  CaAHPN + MobyAHPN + Campaign + ViolAHPN + lnpop +
                  militarybase + militarybasespat + coppedge ,
                alpha = 0.05,
                data = modData, se_type = "stata", clusters = munid)

iv_s2sls = iv_robust(PoliceRepression_bin ~ damage_decay +
                       PoliceRepression_sw +
                       CaAHPN + MobyAHPN + Campaign + ViolAHPN + lnpop +
                       militarybase + militarybasespat + coppedge | fault +
                       CaAHPN_sw + MobyAHPN_sw + ViolAHPN_sw + Campaign_sw + lnpop_sw + coppedge_sw + militarybase_sw + militarybasespat_sw + # instruments for the spatial lag of DV
                       CaAHPN + MobyAHPN + Campaign + ViolAHPN + lnpop +
                       militarybase + militarybasespat + coppedge ,
                     alpha = 0.05,
                     data = modData, se_type = "stata", clusters = munid)

labs = c("Intercept",
         "Infrastructural Damage", "Overt Challenges", "Mobilization Activities", "Campaign Activities", "Insurgent Violence","Ln Population",
         "HQ Location", "HQ Distance", "Democratic Inclusion", "Spatial Lag")

screenreg(list(iv ,iv1, iv2, iv_s2sls), include.ci = F,
       caption="IV Results (2SLS): Police Repression",
       label = "tab:main",
       digits=4,
       stars = c(0.01, 0.05, 0.10),
       custom.model.names =c("2SLS","2SLS","2SLS",
                             "S-2SLS") ,
       custom.coef.names = labs,
       fontsize = "footnotesize",
       include.variance = F,
       include.dispersion = F,
       include.aic = T, include.bic = T,
       include.adjrs = T,
       include.nobs = T,
       include.loglik = T,
       include.groups = F,
       include.intercept = F,
       caption.above = T,
       include.fstatistic = T,
custom.note = paste("%stars. ", "Standard Error Clustered at the Municipal Level.")) # intercept omitted ##
## =======================================================================================
## 2SLS 2SLS 2SLS S-2SLS
## ---------------------------------------------------------------------------------------
## Intercept 0.0283 *** 0.0283 *** 0.0283 *** 0.0283 ***
## (0.0009) (0.0008) (0.0008) (0.0008)
## Infrastructural Damage 0.0033 *** 0.0027 ** 0.0027 ** 0.0027 **
## (0.0013) (0.0013) (0.0013) (0.0013)
## Overt Challenges 0.1930 *** 0.1909 *** 0.1896 *** 0.1899 ***
## (0.0226) (0.0215) (0.0215) (0.0215)
## Mobilization Activities 0.0361 * 0.0355 * 0.0354 * 0.0354 *
## (0.0210) (0.0208) (0.0207) (0.0207)
## Campaign Activities 0.0245 *** 0.0236 *** 0.0236 *** 0.0236 ***
## (0.0027) (0.0027) (0.0027) (0.0027)
## Insurgent Violence -0.0884 *** -0.0889 *** -0.0881 *** -0.0882 ***
## (0.0231) (0.0220) (0.0220) (0.0220)
## Ln Population 0.0076 *** 0.0071 *** 0.0071 *** 0.0071 ***
## (0.0017) (0.0016) (0.0016) (0.0016)
## HQ Location 0.0051 *** 0.0051 *** 0.0051 ***
## (0.0016) (0.0016) (0.0016)
## HQ Distance 0.0025 *** 0.0022 ** 0.0022 **
## (0.0009) (0.0009) (0.0009)
## Democratic Inclusion -0.0149 *** -0.0128 *** -0.0132 ***
## (0.0017) (0.0016) (0.0018)
## Spatial Lag 0.0053 *** 0.0043 **
## (0.0014) (0.0018)
## ---------------------------------------------------------------------------------------
## R^2 0.4964 0.5053 0.5061 0.5061
## Adj. R^2 0.4963 0.5051 0.5059 0.5059
## Num. obs. 27216 27216 27216 27216
## F statistic 155.1843 152.8317 139.6139 140.5551
## RMSE 0.1177 0.1166 0.1165 0.1166
## N Clusters 324 324 324 324
## =======================================================================================
## *** p < 0.01; ** p < 0.05; * p < 0.1. Standard Error Clustered at the Municipal Level.Exclusion restriction justification
Because ER cannot be tested, reviewers will usually require in-dept discussion why readers should believe that this assumption holds. You not only need to justify it but also think about potential concenrs and address them beforehand.
Here is what we said: ``One important assumption is the exclusion restriction; the instrument (Z) does not have a direct causal effect on the outcome (Y) and only affects changes in the outcome via the path through the treatment (X) (Sovey and Green 2011). We expect that the earthquake shock (Z) has no direct effect on the decision to repress (Y) because repression behavior is a result of political calculation by the government and strategic responses to political threats. The decision to use violence has little to do with where a natural disaster took place. However, the earthquake shock can indirectly impact repression behavior through declined state capacity as our theory indicates, and one of the key areas of declined state capacity is local infrastructure (X), such as roads and communication systems, that facilitate police to monitor and control dissidence. While infrastructure is a key pathway that connects the instrument to our outcome, it is possible that the earthquake may indirectly affect the decision to repress via other backdoor paths, such as the level of dissent activity or local population change. In our analysis, we will control for dissent activity and demographic shifts to ‘blocks’ the potential backdoor paths that could circumvent the treatment variable. In other words, by holding the different kinds of challenger behavior and demographic changes constant, we can exclude the possibility that the earthquake shock affects the likelihood of repression by bypassing its influence through our main predictor—infrastructural damage. In the conflict scholarship, natural disasters, such as tsunami and earthquakes, are increasingly used as instruments in studying state or insurgent violence (Kikuta 2019; Montalvo and Reynal-Querol 2019), thus increasing our confidence in utilizing the earthquake shock as the instrument in our empirical design.”